We first need to look at the original document of our MSS ledgers.
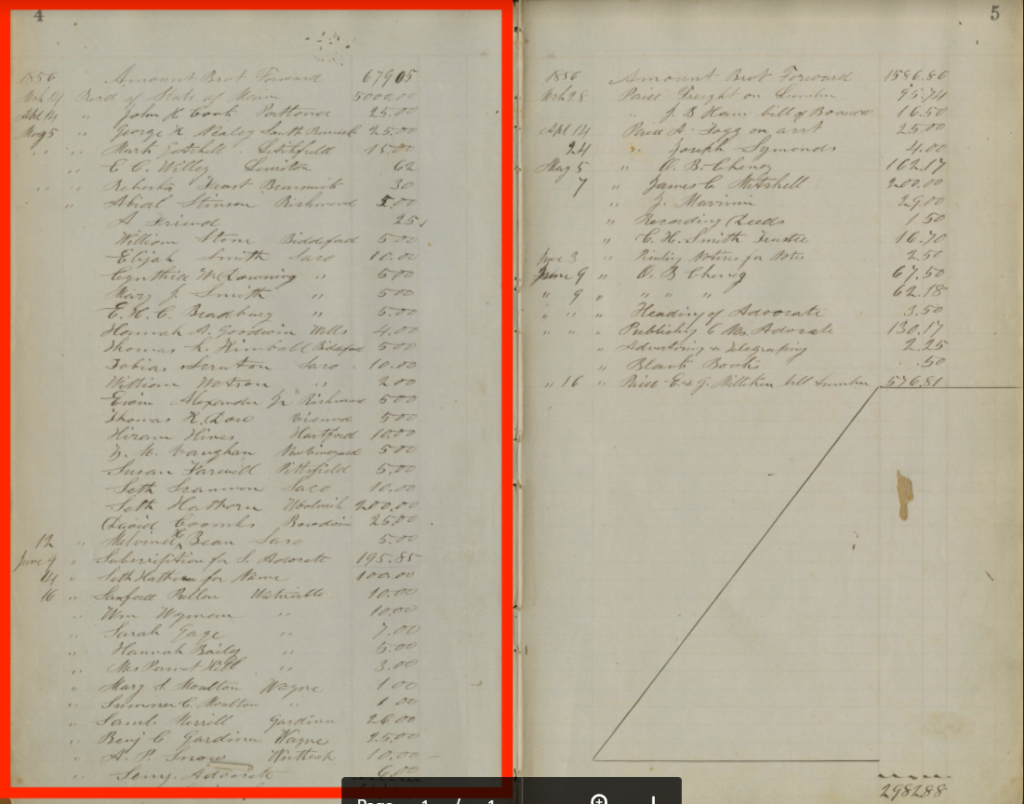
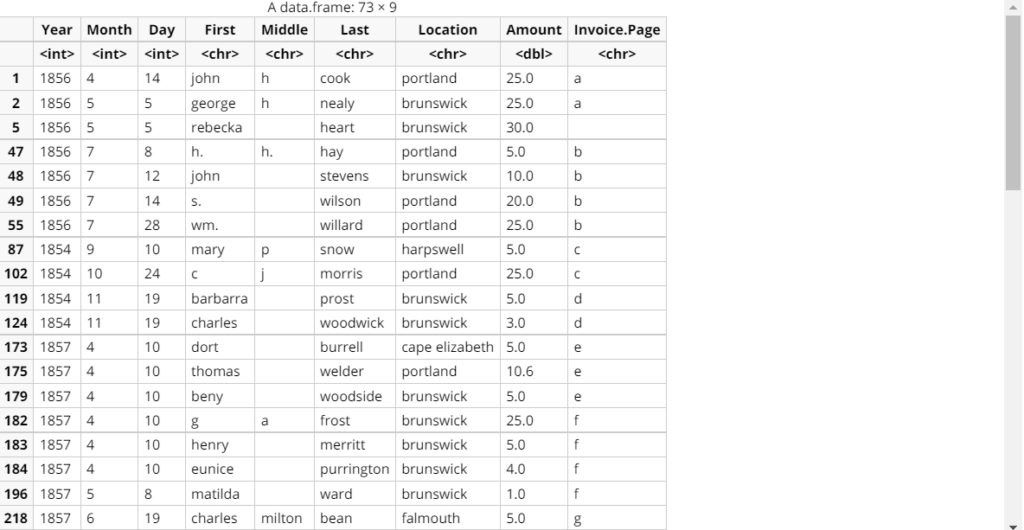
From the original scripts, we identify the errors and create a revised version of dataframe so that we can conduct further analysis.
In understanding the MSS ledgers, we really need to think about the general strucutre of this “dataset”. We can first identify that there are nine columns and 584 rows in total. For the 584 observations here, we have Year, month, day, First, Middle, Last name, location, amount and invoice page 9 different variables.

After that, we probably want to ask what is the donation amounts of each unique year. So we can get the answers by subsetting the donations from different unique years. Furthermore, we want to see the distribution of the three subset groups so that we draw the histograms.


Also, we want to know the donations in terms of locations. So we subsetting the dataframe again and get further details about , for example, the donations from Cumberland County.